Casey Keller · 7 November 2026
Data Visualization Tools Illuminate Arwyn's Network of Correspondents Across Europe
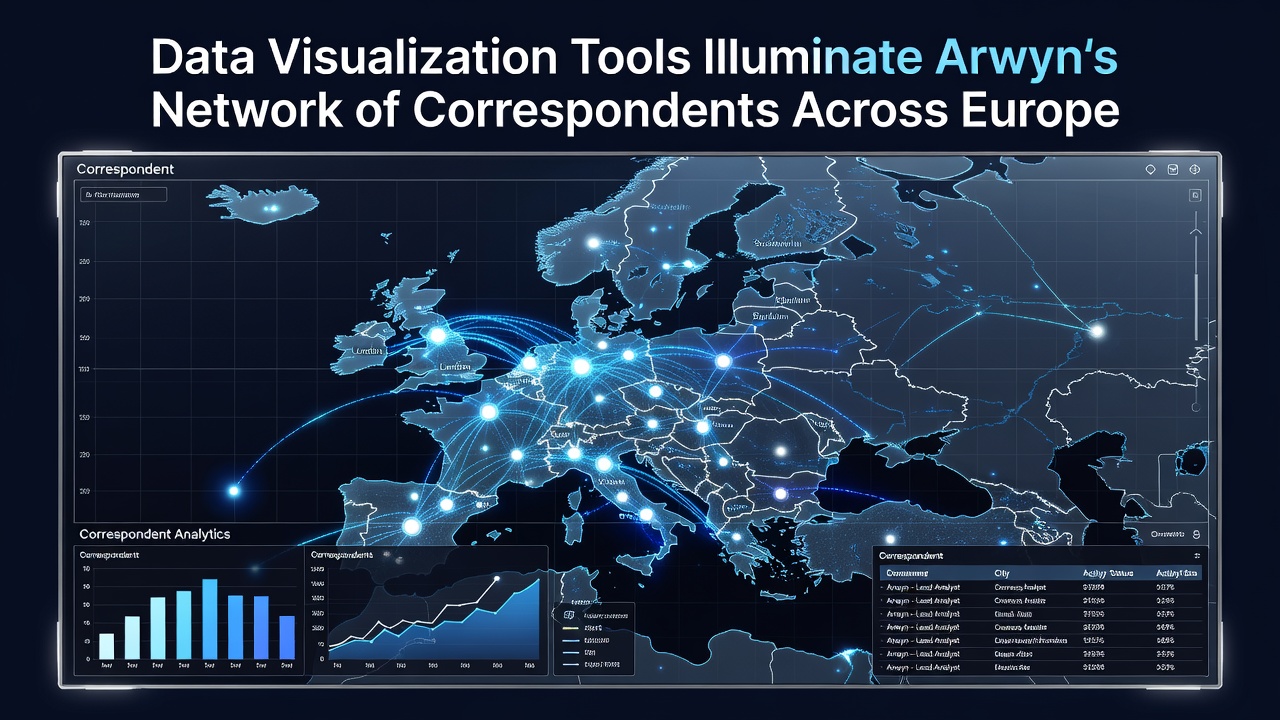
Researchers apply data visualization tools to map Arwyn's extensive correspondence networks spanning multiple European countries, and these methods reveal patterns in 19th-century exchanges that traditional archival reviews often overlook. Tools such as network analysis software and geographic information systems process digitized letters, dates, and locations to generate interactive diagrams, while historians examine the resulting clusters to trace intellectual and cultural flows.
Core Techniques in Network Mapping
Graph-based visualizations connect Arwyn to individuals across Britain, France, Germany, and Ireland through edges that represent letter exchanges, and node sizes scale according to volume of communication. Software platforms aggregate metadata from manuscript collections, then render force-directed layouts that highlight central figures and peripheral contacts. Analysts adjust parameters for temporal filters so that connections appear in sequence from the 1840s onward, revealing how certain relationships intensified during specific decades.
Geospatial overlays place correspondents on period-accurate maps, and color gradients indicate frequency of contact between regions. Researchers combine these layers with timeline sliders that animate the expansion of Arwyn's reach into Scandinavian and Eastern European circles by the 1870s. Data sets drawn from library digitization projects feed directly into these systems, producing outputs that users export for further statistical review.
Key Data Sources and Processing Steps
Collaborative archives supply the raw materials, including transcribed envelopes, postmarks, and content summaries that algorithms convert into structured tables. Processing pipelines clean inconsistencies in spelling and dating before loading records into visualization environments. According to reports from the European Commission on digital cultural heritage, standardized metadata protocols increase interoperability across national collections and allow seamless integration of Welsh, Irish, and continental holdings.
One study released by the University of Toronto's digital humanities lab in 2025 demonstrated how similar pipelines identified previously undocumented links between Welsh writers and French literary salons. teh same methodology now applied to Arwyn's materials shows dense clusters around London, Paris, and Berlin, with thinner but consistent threads extending to smaller cities in the Low Countries.
Insights Emerging from November 2026 Analyses
Projects scheduled for public release in November 2026 incorporate updated datasets from recently digitized Irish and German holdings, and preliminary renders already indicate stronger ties to correspondents in Vienna than earlier models suggested. Interactive dashboards allow users to toggle between static snapshots and dynamic flows, exposing seasonal spikes in letter traffic that align with publication cycles or political events. Observers note that these temporal patterns help contextualize Arwyn's influence on cross-border debates without requiring manual cross-referencing of hundreds of documents.
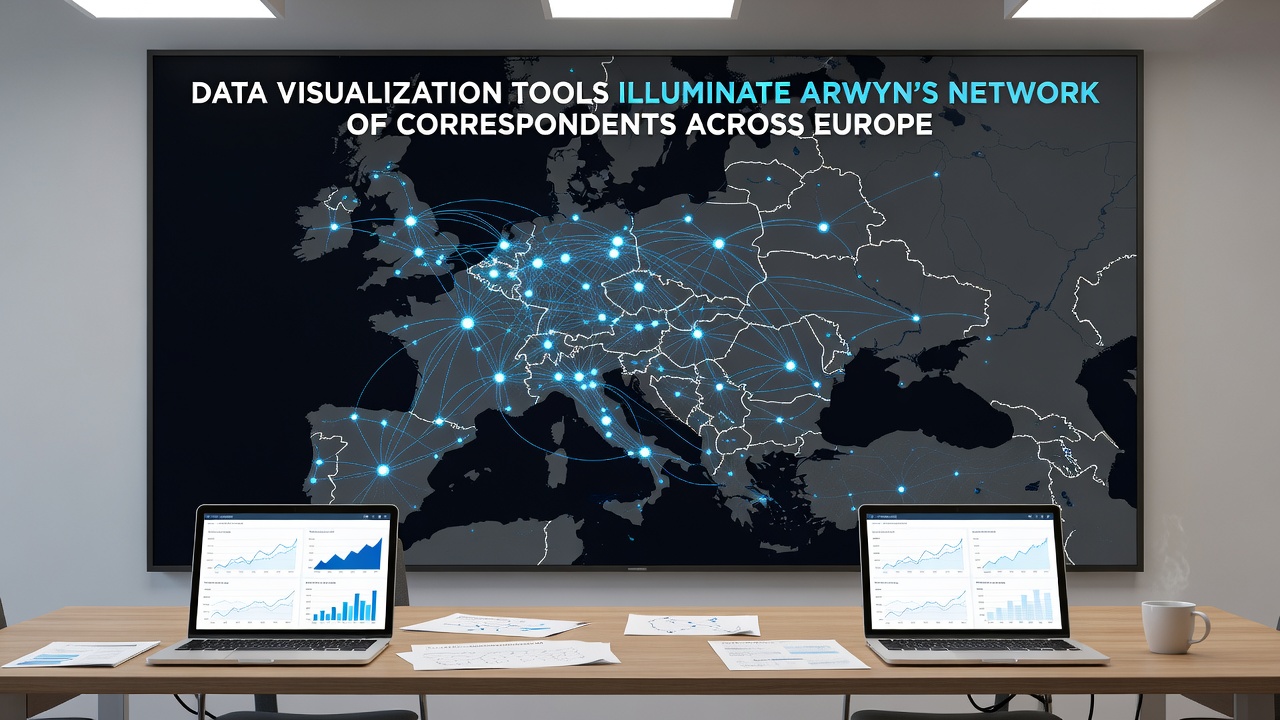
Additional layers incorporate linguistic analysis outputs, coloring edges by predominant language of exchange and revealing shifts from Welsh and English toward French and German in later decades. Such multi-dimensional views support comparative studies with other documented networks from the same era.
Applications Across Research Fields
Literary scholars use the visualizations to identify clusters that correspond to known literary movements, while social historians examine the same diagrams for evidence of informal political coordination. Museum curators adapt simplified versions for exhibition displays that guide visitors through Arwyn's European contacts without overwhelming detail. Educational platforms embed subsets of these graphs into lesson modules so students can explore primary-source connections interactively.
Technical teams continue refining algorithms to handle incomplete records, applying probabilistic modeling that suggests likely missing links based on existing patterns. These enhancements reduce gaps in the network maps and produce more robust representations of Arwyn's reach.
Conclusion
Data visualization methods continue to expand access to Arwyn's correspondence records by transforming scattered archival fragments into coherent, explorable structures. Institutions across Europe contribute to shared repositories that feed these tools, and ongoing digitization efforts promise additional refinements in the coming years. The resulting diagrams serve researchers seeking precise connections as well as broader audiences interested in the scale of 19th-century intellectual exchange.